
|
When reviewing Dervin, I looked at how she discusses a time-line interview. She breaks her recording into three categories: “The Events, The Gaps, and The Helps.” I liked this visual model. “The Events” states the situation the individual is working through, “The Gaps” are the questions that individual has in order to work through their situation, and “The Helps” are what will lead to the resolution(s). These three simple categories helped illustrate the gap-bridging she was describing throughout her writing. This also reminds me to use clear visual models when designing my prototype.
Dervin stated that sense-making focuses on behavior. Behavior can be a reaction to ideas used in the past, or incorporate new ideas when an individual is placed in a new situation I believe this shows the importance of being inclusive when gathering data. Dervin talks about “The Observer Versus the Actor.” She states that the majority of our current research asks questions from an observer’s perspective. She said that we can construct a world for the users which makes things less authentic. I thought this was very helpful as we are collecting data for our capstone project. It’s important to take a step back, and focus on the actor (our students) in a more authentic way, and not pushing them into a small study to get data out of. I will be showing data that is a combination of qualitative and quantitative in order to focus on getting the complete picture of my students. The TPACK video entitled, “Intro To TPACK” by Punya Mishra provides a clear overview of this important model. The video provides a quick overview of the TPACK model after asking, “What do teachers need to know?” - The content- what is being taught - Pedagogy- how we will teach it - Technology- the tools that allow us to represent ideas and share them with one another These three components interact with one another constantly. The “sweet spot” of teaching is in when all three of these are overlapping. I liked how Mishra said how this model is the total PACKage with teaching with technology. A child has more information to knowledge now than at any other time in the human race simply through access to a search engine. Mishra brought up some important aspects of technology: - Technology changes how we teach, technology changes pedagogy - Technology also changes what we teach- the content - Technology changes the contexts that teaching and learning happen within The transformation of content due to technology is drastically different in all content areas than it was just a decade ago (i.e. math, music, science, art, history, etc.). With access to technology, students can experience alternate forms of learning. This can be through web based videos and support (like Khan Academy), through online learning (like this Master’s program), and through viewing different representations of what students are learning (like different visual representations of the Periodic Table). As educators, we know that students learn in many different modalities. Technology is a tool that can be used to help students learn in a more individualized way. It is important to remember that technology is a support to content, not a replacement of content. It should be used to strengthen our lessons and support student learning and understanding. After reviewing this video, I believe it is important for me to to highlight the technology I am using in my capstone. I used technology programs for math like Prodigy and Sumdog to support student learning. I used Google Classroom to assign videos and quizzes that were created on Google Forms in order to get immediate student feedback and provide 1:1 support. This also provides the opportunity to redesign/readjust student learning experiences based on student feedback. When designing my prototype, I began to look for ways to highlight this technology instead of just embed it into the design. It will be important to also clearly define my pedagogical design of the lessons. This includes instructional strategies like Think-Pair-Share to support collaboration. To design instruction for each individual student I have broken my content into small groups for math, and facilitated student conversation opportunities about inquiry and growth mindset in mathematics. I like the idea of clearly listing the specific pedagogical tools used in this capstone project in a list format. Finally, the content knowledge for my capstone includes studying the math curriculum before instruction, researching about inquiry and growth mindset, and applying my research to designing student instruction. It will be important for my prototype to clearly define these components as well.
1 Comment
My Essential Question has evolved into: How does inquiry based instruction and a positive math mindset increase student performance in the mathematics classroom? This study takes place in a fourth grade classroom. The purpose of this study is to use data to determine if developing inquiry strategies in mathematics will help increase a positive math mindset, resulting in higher student performance on Bridges in Mathematics assessments. Bridges in Mathematics, currently being used in a northern California elementary school, is a Common Core aligned math curriculum created by the Math Learning Center.
Through teaching inquiry, this study will measure student’s math mindsets and performance levels in Bridges in Mathematics. The following themes were identified: inquiry, positive math mindset, and collaboration. Through this study, I will model Arthur Costa’s Levels of Questioning into mathematics, as well as provide opportunities for students to apply their learning in order to ask leveled questions within mathematics. The justification for this process is that it will help them understand how to apply questioning in mathematics and become aware of their metacognitive thinking and strategies. Students will learn about the brain and how to use a growth mindset in the mathematics classroom. I plan to embed videos, tutorials, and visual graphics into their google classroom links in order to support student learning. I will facilitate student conversation focused around inquiry and a positive math mindset. Where I initially struggled was in the combination of data to use in order to support my study. Through one-on-one meetings and personal study, I have decided to do use both quantitative and qualitative data. Quantitative data, such as the Bridges in Mathematics assessments, will monitor student performance and growth based on Common Core Standards. Student observation in both mindset and inquiry will provide qualitative data. The combination of both quantitative and qualitative data will yield more powerful and concrete results. The evolution of my thought and practice became more defined as I applied my area of study to the instructional design models we have been learning about. The Pebble in the Pond model states that you start with the, “pebble” which represents the problem. From there you design instruction with procedures based around solving that problem. I will partly model my steps after this model by using sequential order with clear procedures. Problem = Students lack the ability to apply inquiry skills and a positive math mindset within mathematics Analysis = Summary of learning, obstacles/limits for learning, ways that obstacles were overcome, focus on key learning, looking at the next steps, Strategy = Think-Pair-Share, applying Arthur Costa’s Level’s of Questioning within mathematics, Google Forms for immediate and individual feedback, Bridges in Mathematics student performance assessments, informal assessments, monitoring student conversation, whole class direct instruction, and small group instruction Design = Video tutorials, quizzes, polls, open-ended questions, facilitating student conversation based on inquiry and metacognitive thinking, redesign/readjust student learning experiences based on student feedback Production = Completion of Bridges in Mathematics assessments, the ability to articulate the inquiry process in mathematics, the capacity to display a positive math mindset. The SITE Model (Sociocultural, Informational, Technical, and Educational) intertwines connections between the learner and three sub-contexts: informational, sociocultural, and technical. One goal of the SITE Model is to have the designer understand the context of the learners in order to design products (or curriculum) that will enable the learner to successfully engage within that context in order to gain skills and knowledge that will help them accomplish their educational goals. My goal is for my students to understand how to use inquiry along with a growth mindset in mathematics in order to show growth in student performance. Clark writes that to successfully teach a task, one must first teach a set of procedures for how to successfully complete that task. A successful format that Clark uses is to first list the step, the action, followed by an example. To use inquiry in mathematics, the instructor must first teach the procedures that lead to using inquiry successfully. Procedures will be a big part of my capstone. I am envisioning large numbers representing the steps for teacher’s to take in order to teach inquiry and implement a positive math mindset in their classrooms. Each number would have a link that takes them to a clear set of procedures to complete that particular step. To answer the question about how my knowledge of TPACK has evolved in my practice, I first had to refresh my brain in the TPACK model. I found a helpful video on Common Sense Education that I will link below. With the TPACK it is important to start with content and pedagogy, and then layer in technology. This ensures that I will not loose site of goals and objectives for student learning Technological- This step addresses how to select use, and integrate technology into teaching. It is important to focus on the content of the technology so that it provides deep and lasting learning. I used technology programs for math like Prodigy and Sumdog to support student learning. I used Google Classroom to assign videos and quizzes that were created on Google Forms in order to get immediate student feedback and provide 1:1 support. This also provides the opportunity to redesign/readjust student learning experiences based on student feedback. Pedagogical- This is, “the how” that has to do with learning theories and instructional design. I have used instructional strategies like Think-Pair-Share. To design instruction for each individual student I have broken my content into small groups for math, and facilitated student conversation opportunities about inquiry and growth mindset in mathematics. Content Knowledge- This is, “the what” that has to do with teacher expertise on the content taught. This includes facts and concepts. I study the math curriculum before instruction, research about inquiry and growth mindset, and applying my research to designing student instruction. One place this is done as at our Number Corner where students have conversations about their thinking while using math vocabulary. This collaborative time allows for students to interact with the content in a meaningful way. TPACK Model Video on Common Sense Education: https://www.commonsense.org/education/videos/introduction-to-the-tpack-model After my one-on-one, we reformatted my question slightly to: “How does inquiry based instruction, paired with a positive math mindset, increase student performance in the math classroom?” Starting with, “how” vs. “does” will allow for me to present my research in a different way. Instead of, “yes/no,” I will be providing the “how.” The way I see this happening is by providing a sequential list of steps to answer this question. I envision each step being a link the user can click on to take them to a more detailed description of how to complete this step. Each step will have a set of procedures to get to the end goal.
I was inspired to gather more qualitative data for my research. This will include categorizing student conversations/comments in math into two categories: inquiry and math mindset. Both qualitative and quantitative research will provide data to effectively support my essential question. I liked the idea of using a word cloud generator to visually display the most common words/ideas expressed within the math classroom. I have been mainly focused on graphs and charts, and I like the idea of a different form of data presentation, especially for qualitative data. The SITE Model (Sociocultural, Informational, Technical, and Educational) intertwines connections between the learner and three sub-contexts: informational, sociocultural, and technical. One goal of the SITE Model is to have the designer understand the context of the learners in order to design products (or curriculum) that will enable the learner to successfully engage within that context in order to gain skills and knowledge that will help them accomplish their educational goals. This is important to keep in mind as I design my capstone project. I will keep in mind what motivates my learner, and the ways that will be the most effective to have the learner engage in the curriculum. When I go to math websites to get resources, I appreciate the clarity of sequential steps. This is why I want to make sure I have clear steps and procedures listed in my capstone. My main focus has been on using inquiry in mathematics, and teaching students how to cultivate a positive growth mindset in order to increase student performance on Bridges in Mathematics assessments. I chose this are of study, because these are the areas I desire to know more about as an educator because of the needs I saw in my classroom. When I think about scaling my research for a larger audience, I envision an online resource for educators to access based around these topics. I believe that other educators would benefit from learning more about using both inquiry and growth mindset principles in mathematics with their students. The question is, How will I share this information in a way that is effective?
Our readings this week had a lot of information about sharing information effectively. In Dr. Bobbe Baggio’s book, “The Visual Connection,” we learned that visuals draw the learner’s attention to the material being taught. When I present my learning, I must remember to use effective visuals However, I must also remember that content is king, and visuals support the content. I learned that I should develop a visual strategy and write it down. My strategy should be determined by my content, learning objectives, and learner. One phrase Baggio used a few times was, “attention on intention,” meaning draw focus through visuals to the main learning goals I want my learners to remember. The objectives should be part of my visual strategy. In Clark’s reading this week, I learned that to successfully teach a task, I must first teach a set of procedures for how to successfully complete that task. This is going to mean explicitly laying out clear objectives, and procedures to reach those objectives, in the digital resource I will create. There was a clear visual in Clark’s book with three categories: Step/Action/Example. This clear format made it very easy to understand the procedures, as well as the final objective. I may consider using this type of formatting when presenting information in my project. Clark discussed how technology can be used to further enhance understanding by having graphics, 360 degree views, tables, diagrams, etc. Dervin talks about “The Observer Versus the Actor.” She stated that the majority of our current research asks questions from an observer’s perspective. She said that we can construct a world for the users which makes things less authentic. I thought this was very helpful as I am currently collecting data for my capstone project. It’s important to take a step back, and focus on the actor (my students) in a more authentic way, and not pushing them into a small study to get data from. It will be very important to share my data in an effective, objective, clear way for my capstone project. There are many components to consider when creating a resource for this project. Dervin’s “Qualitative Research in Information Management”
Baggio’s. “The Visual Connection Chapter’s 4-6
Connect Dervin & Baggio: Discuss ‘Visual Learning’ in the context of Sensemaking and 21C learning One connection I saw between Dervin and Baggio is the idea of thinking about context within teaching and learning. Dervin stated that sense-making can be objective. One person may wish to use accuracy to measure something, where another person may use familiarity to measure something. When people share personal observations, there are limited observations. This tied into what Baggio discussed about how prior knowledge, context, and expectations influence the way people learn. Baggio wrote that context is important to learning because it provides relevance, which gives it the level of importance to the learner. Clark Chapters 1-2: Describe four core ideas as I connect to at this stage of the Innovative Learning Program
SITE Model
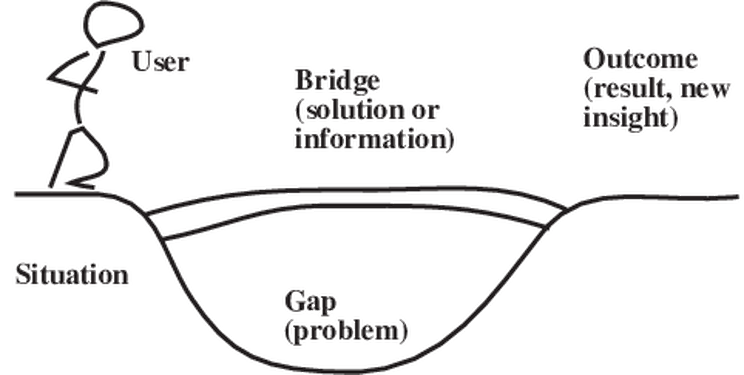 Image uploaded by Olav W. Bertelsen, Retrieved from ResearchGate This week we read Chapter six in, “Qualitative Research in information Management.” We read an excerpt from Brenda Dervin’s entitled, “From the Mind’s Eye of the User: The Sense-Making Qualitative-Quantitative Methodology.” My meta-cognitive process for dissecting this article was to first recall prior knowledge, then read through the article, make notes on the main “take-aways” I got from the excerpt, and finally to find media to help support what I learned via google images and YouTube. The title of this excerpt immediately reminded me of the book we read last semester entitled, “Action Research: Teachers as Researchers in the Classroom” by Craig A. Mertler. This is where we first learned about qualitative vs. quantitative research and data collection tools. I started by reviewing my notes before beginning Brenda Dervin’s article. Mertler stated that characteristics of qualitive data are: accuracy, credibility, and dependability (pg. 114). Mertler stated that the practices that ensure the quality of qualitative data are triangulation, member checking, and prolonged engagement and persistent observation. This includes triangulation, which is the use of multiple data to ensure the trustworthiness of the data. Member checking is the importance of sharing data sources with the participants of the study to make sure I represented their ideas accurately. Prolonged engagement and persistent observation means that I have developed trust with my students and observed behavior to the point of being routine. Mertler wrote that quantitative data is numerical; anything that can be counted, calculated, or rated can be considered quantitative (pg. 116). This includes surveys, closed-response questions, or multiple choice questions that the participant responds to. This information from Mertler is what I knew about qualitive research and data collection prior to this week’s reading. As I read Dervin’s article, I learned that data collection is just a small part of qualitive research. Dervin states that the purpose of this book is on qualitative research, but that there is also a quantitative approach in this chapter. She stated, “In the argument between qualitative and quantitative approaches to research, sense-making likewise refuses to choose a side. It is explicitly both qualitative and quantitative.” (pg.81). Reading about qualitive and quantitative research within the context of sense-making, added more depth and understanding. Dervin stated that sense-making includes finding a set of methods that have been developed to study the making of sense that people participate in their everyday experiences. Sense-making refers to methods for studying human information to use when others want to know about behavior. My Take-Aways:
If I taught this same reading content to a high schooler, I would start by showing this YouTube Video on Sensemaking by Adopt&PF (see below). In addition to this YouTube, I would embed images into my presentation (i.e. the image included in this blog). I would make sure to present this information piece by piece, and allow time for partner discussion in order for the students to better process what they are learning. The use media and visuals will help break it into mind-sized chunks to make it easier to understand. Essential Question: Does inquiry based instruction develop a positive math mindset and increase student performance on Bridges in Mathematics assessments?
My essential question has remained the same as semester one. This research ins innovative because it focuses on using inquiry in mathematics, cultivating a positive math mindset, and it can be adopted on a larger scale by others. The findings in this study influenced my thinking on inquiry and a growth mindset in mathematics. I found that both of these components helped students increase their math scores, as well as increase their math mindsets. There were three different assessments at the beginning and end of this study: a Math Mindset survey, an Inquiry Survey, and a Bridges in Mathematics test. The pre-test and post-test data was compared to evaluate if these methods of instruction were effective to help increase a positive math mindset, resulting in higher student performance. The data from this study shows an overall increase in student scores. The difference in the pre-test and post-test scores for the Bridges in Mathematics test entitled, “Multi-Digit Multiplication and Early Division” show increased student performance overall. 38% of students scored Far Below Basic in the pre-test, and 6% of students scored Far Below Basic in the post-test. This shows that 32% of students moved out of the Far Below Basic level. The pre-test and post-test data for the “Math Mindset” survey show an increase in math mindset. The largest increase came from the question: “Mistakes are valuable! I believe that mistakes grow my brain!” The True response rose by 10.1% in the post-test. The difference in the pre-test and post-test scores for the “Math Inquiry” survey show an overall increase of student understanding. In the pre-test, 95% of students scored Basic or Far Below Basic. In the post test 65% of students scored Far Below Basic in the post-test. This shows that 35% of students moved out of the Basic and Far Below Basic levels. The data that took place in this study supports the importance of implementing inquiry in mathematics in order to develop a positive math mindset and student performance on Bridges in Mathematics assessments. Interlacing inquiry into mathematics curriculum will allow students to find connections, discuss the logic of mathematics, and reason. Cultivating a positive math mindset is a natural step to bringing this process to fruition. In order for a child to reason and be successful, they must persevere. Inquiry seeks to provide students with the tools to be successful in complex math problems, and a positive math mindset provides students with the motivation to persevere in completing these complex math problems. I will continue to teach with a focus on inquiry and a positive math mindset while I collect data from the Bridges in Mathematics curriculum. Running multiple data cycles will bring further validity to this study, and bring more clarity to the effectiveness of these tools. |
AuthorWrite something about yourself. No need to be fancy, just an overview. Archives
May 2019
Categories |
 RSS Feed
