|
Transliteracy has influenced my thinking around my Capstone Project, and has enhanced my craft as an education innovator. Transliteracy allows students to understand how media works in a variety of ways. It allows for students to read, write, and interact across a range of platforms, tools, and media. It is the convergence of literacies across platforms and medias. Our students must be transliterate in order to thrive in education, and in their future careers. Technology is ever-changing. Transliteracy requires students to think like a designer and to be excellent communicators, all while expanding their learning.
We have learned about so many valuable tools in our Innovative Learning program. These tools have helped me grow in the area of transliteracy. My capstone project answered this question: How does implementing technology and a growth mindset increase student performance in the mathematics classroom? I learned about an In-Class-Flipped Model of teaching. I used this in my capstone. I created video content as well as used CCSS-aligned videos to place in Google Classroom. This model of teaching also helped me better understand the importance of transliteracy for both the student and the teacher. Students learned about Digital Citizenship. They interacted with CCSS-aligned math technology programs like Sumdog, Khan Academy, and Prodigy to support student learning. Google Classroom was utilized to assign videos and quizzes via Google Forms in order to get immediate student feedback and provide one-on-one support. Every teacher wants to individualize their instruction to meet the need of each individual child in their classroom. The difficulty with meeting this goal is time. Using transliteracy is part of the answer to how we can do this. Allowing students to have access to a variety of tools to express their learning will automatically individualize instruction while increasing student engagement. Transliteracy increases student engagement as well as inclusion.
0 Comments
 This week I focused on my Executive Summary and the Poster. I found a similar issue I shared with completing my capstone video-editing my content! For the video, I needed to edit my content to stay in the 90 second time frame. For the Executive Summary and Poster, I am working to edit my writing and data graphs to fit into the 2-3 page maximum, and within the poster perimeters. We learned that white space is our friend, meaning we don’t want to over-clutter our posters. I am keeping this in mind as I select the most pertinent information and data to display.
I began with the Executive Summary before I began my poster. I started with seven pages, and have been slowly editing it down to fit the correct page requirements. It is difficult to summarize a year’s worth of work into a few pages. I believe that one of the benefits of doing this will be that it will highlight the essential pieces of my capstone project. This will be the written version of the, “Elevator Pitch” we learned about. It feels pretty exciting to finally be at the point of completing our posters. I remember when our Cohort went to the Poster Display Party in December of last year to view the previous cohort’s posters. I remember thinking how much work it looked like. Now, we are at that FINAL step! Yay Cohort 16! I found my two biggest struggles for the poster were choosing which data to display, and the “Conclusions and Next Steps” portion of the poster. I have collected a lot of data, and want to make sure that I am choosing the most impactful pieces to share. I ended up creating a new growth mindset word cloud in the shape of a brain. I did this to replace the growth mindset pie charts I originally had. I did this because I thought it was looking too pie-chart-heavy in my “Data” section. However, I am now concerned that the brain word cloud (student words describing the impact of wearing Growth Mindset Bracelets) may look unprofessional compared to a pie chart. I would love to get some feedback on this. My Capstone Video is now complete! The greatest struggle I had was managing my time (keeping it to 60-90 seconds). This process took a lot of re-writes to my script, and an elimination of unnecessary slides. I also found I was able to combine slides by cutting out portions of the content. This process really made me focus on what was ESSENTIAL to explain my capstone project. So many rounds of data, research, writing, and projects went into this capstone. Sifting through the information and highlighting the most important aspects of the project made everything a lot more clear. By keeping to a 90 second time frame, it made sure it was within the time from of an “elevator pitch.”
I know and understand all of the steps, research, and data behind the project; and I wanted to make sure that in my effort to cut my video to 90 seconds I wasn’t loosing essential pieces of what my Capstone Project entails. I felt very “close” to this project in the sense that I was zoomed in, not looking at it from a broad perspective. Because of this, I showed my video to some family members and asked if they could clearly understand what my project was, why it was important, and understand the pieces of data that were displayed. It was helpful to get their feedback. The end result (hopefully) is a video that highlights the main pieces of my capstone, and intrigues the reader to want to further explore the contents of my Capstone Website.  I started planning my Capstone Project video on the template we were given in last week’s iCare. What I like about that template is that it allows me to visually see the video I am producing, one slide at a time. I am using Adobe Spark, so I was able to make notes about my visuals specific to that program. My visuals include stills, slides with words, and videos. Writing the script piece by piece under each image was very helpful with planning the flow of the video.
The biggest problem that I encountered is time! I realized I had too much content in my script. This became clear as I began reading my script aloud. I didn’t want to read quickly through my script and have my video appear rushed. This meant that I had to go back through my script and find the essential content. I highlighted the slides I knew I MUST have in the video and then began focusing on completing those specific slides. This helped me clearly define what I want my audience to understand about my Capstone Project. The process of focusing on completing the essential slides first, and filling in the gaps after those slides were completed, proved to be the most helpful solution to troubleshoot my time issue. The process of cutting slides can be difficult, but I know the time limit will ensure I am highlighting only the essential pieces of my Capstone Project. I began with reading the article entitled, Digital Writing 101: GUIDE – The Elements of Digital Storytelling. This article clearly outlined the main components of Digital Storytelling as follows:
These simple bullet points were a great starting point to help me better understand how I would create my digital story map and write my script. Tips this article offers includes choosing a soundtrack that complements the overall message, keeping a consistent and informal voice throughout the story, and making sure it’s not too wordy. These tips immediately made me think of the many benefits of Adobe Spark. Adobe Spark helps with pacing (making sure each slide is 30 seconds or less), provides a clear outline for inserting videos or images, offers an array of music to choose from, and creates a platform for adding a variety of meaningful content. The Impact of Broadcast and Streaming Video in Education covered many aspects of the importance of creating projects like our capstone video. The section entitled, How Video Technologies Ignite Student Creativity, Collaboration, and 21st Century Skills drew me in. It had a powerful quote discussing why this is an important skill for us to teach our students: “Numerous studies reveal that learners are more motivated to interact with educational content when the content uses narrative storytelling, uses some degree of personalization, or offers some degree of control over how the content is accessed.” This is exactly what we want our students to do as 21st century learners! It was also a reminder to me that in order to teach my kids how to engage in digital storytelling, I personally need to be proficient in it. In Structure Your Presentation Like a Story by Nancy Duarte I learned that a successfully story will set up a conflict that needs to be resolved. Our capstone projects naturally do this. We found a problem we wanted to solve, and investigated how to achieve the goal of solving it. I liked what Duarte stated about creating a bond with your audience through articulating what they already understand. I remember looking at previous capstone sites that successfully did this. I found these sites made me want to read more because they established a very clear problem that all teachers could relate to before they began to discuss how they researched that problem. This is an important element, and one that I want to make sure to incorporate into my video introduction through pulling fellow teachers into my project by identifying common ground In the article entitled, How to Give Great Presentations- Story is Key by Lei Han, I learned that I need to clearly communicate my reasoning to the audience, and that I should leave the audience with plans to take action. This last part was also in sync with the previous article I read. Han states that 50% of our time should be spent on, “writing vetting, and practicing your story” when preparing for the presentation. This means our storyline is going to be a significant part of the process to complete our capstone video. This also made me feel better, because creating the storyline this week was very time consuming! I really liked the Adobe Spark video that I watched from the example list by Nancy Jaminet because it was clear, easy to follow, and had great videos and images. I liked how Jaminet incorporated a short video of her actual website within her video. I would like to do this as well. After reading the articles and watching the example videos, I began brainstorming what I wanted in my 90 second video. I just wrote out phrases and ideas for images in a document. After that, I began creating my Storyboard from the template on the iCare. I chose this template because I found it clear and easy to understand. Writing what I will say for my video in the “Description” box will help me time my script/video to make sure it is fitting into the 90 second mark as well as flowing together seamlessly. This storyboard will help make my video appear cohesive, clear, and establish a strong connection with my audience. This will be something that I continue to work on and perfect before completing my final video through Adobe Spark. I used https://logomakr.com/ when designing my logo this week. I found this site to be extremely user-friendly. I particularly like how there is an introduction video that pops up right when you visit the website. The video is done in a screencast type of format, where there is a voice-over that matches what the user is doing on the screen. The video tutorial shows you how to search for images, change sizes and shapes, and how to use the built-in tools. Additionally, it offers, “5 Logo Tips” to keep in mind while you create your logo (i.e. Keep it Simple, Make Sure Your Logo is 100% Original, etc.). After watching this video, I felt prepared to begin designing my own logo. I have three components I knew I wanted to convey in a visual format: technology, growth mindset, and math. I used these words, and words related, when searching for my images. I ended up creating two logos that I really like and will decide between this week. I highly recommend using https://logomakr.com/ for logo design! For my infographic, I chose to focus on my Research Results. I used https://piktochart.com/ to design my infographic. The process started with going through all of my data results and compiling them to graphs, pie charts, word clouds, and more. The Google Forms add-on, Advanced Summary by Awesome Table, was very helpful in generating this data from my Google Forms results. I also used Google Sheets to create additional pie charts. I wanted to make sure I had a combination of qualitative and quantitative data displayed in my infographic. After compiling the charts and data I wanted to present in a Google Doc, I began to plug them into my infographic. This process took the longest to complete. Selecting the data I wanted to present, as well as omit, took a lot of time. I liked the ability to plug in photos, but there was a limited number of photos I could present so I had to be selective with the data graphs I wanted to display. I liked how user-friendly this site was. I was able to insert shapes, change fonts, upload photos, change backgrounds and more. 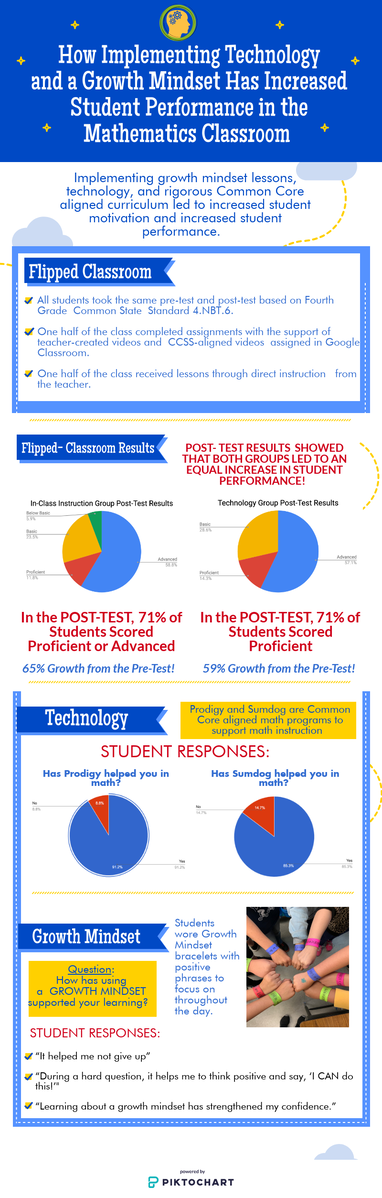 Transliteracy allows students to understand how media works in a variety of ways. It allows for students to read, write, and interact across a range of platforms, tools, and media. It is the convergence of literacies across platforms and medias. Our students must be transliterate in order to thrive in education, and in their future careers. Technology is ever-changing. In class we talked about Web 3.0 and how the web is changing and allowing for a seamless delivery of information across multiple sources. Transliteracy requires students to think like a designer and to be an excellent communicator, all while expanding their learning. I particularly liked this quote from The Aside Blog, Innovation Design In Education: “Transliteracy will become the underpinning of good educational design, because it is driven by the ability to read, write, and interact to communicate ideas to a variety of audiences… From an educational standpoint, this means that learning to design information in different ways is necessary.”” The shift will be teaching my students to answer this question: How can you have your audience learn what you want to share? This is something we think about as teachers all the time. This is now the question we need to teach our students to ask. The importance of transliteracy makes me aware that I need to incorporate a variety of different tools. Students do not need to be experts in each and every individual program, but they do need to understand how each program works. Transliteracy will increase student engagement as well as inclusion. Each individual student will be able to present their learning across varying platforms, medias, and applications. After being exposed to a variety of options, transliteracy will allow for individual adaptation for each student to decide how they want to present their learning. This will increase student interest because they will have the ability to make a choice on how to present. We have learned about so many valuable tools in our Innovative Learning program. These tools have helped me grow in the area of transliteracy. Previous to this Master’s Program, I had never even heard of an in-class flip model. Now, it is part of my capstone! This model of teaching also helps me better understand the importance of transliteracy for both the student and the teacher. Every teaher wants to individualize their instruction to meet the need of each individual child in their classroom. The difficulty with meeting this goal is time. Using transliteracy is part of the answer to how we can do this. Allowing students to have access to a variety of tools to express their learning will automatically individualize instruction while increasing student engagement. |
 RSS Feed
